Forex Trading Strategies
The Foreign Exchange (Forex) market is an intricate network connecting banks, corporations, brokers, and traders from across the globe. It operates 24 hours a day, making it unique among financial markets. A whopping $6 trillion changes hands daily, making it essential for anyone wishing to participate to have a clear and comprehensive strategy. Understanding the dynamics and nuances of this market can be the difference between success and failure.
Basic Concepts of Forex Trading
Definition of Forex Trading: At its core, Forex trading is about the exchange rates between currencies. Traders speculate on the future direction of these rates to profit from their fluctuations.
Major vs. Minor Currency Pairs: Major pairs are the most traded and are usually paired with the USD, such as EUR/USD or GBP/USD. Minor pairs, on the other hand, are less liquid, don’t always include the USD, and often represent regional currency pairings.
Importance of Economic Indicators: Think of economic indicators as the health vitals of a country’s economy. They can hint at its future performance and, thus, the potential direction of its currency. These indicators can range from the unemployment rate to consumer confidence, and traders keep a close eye on their release dates.
Importance of a Trading Strategy
The Forex market is complex and without a coherent trading strategy, a trader is essentially navigating blind. A trader’s strategy is like a sailor’s compass and the unpredictability of currency prices necessitates a methodical approach:
- Navigating Complexity: The sheer volume of information available can overwhelm traders. A strategy helps narrow focus, allowing traders to concentrate on specific data points and market conditions.
- Risk Management: Every investment carries risk. A robust trading strategy outlines risk parameters, ensuring traders never expose more capital than they’re willing to lose. This includes setting stop losses, determining maximum drawdowns, and deciding on risk-to-reward ratios. Without these safeguards in place, a single poor trade could devastate an entire trading account.
- Decision Framework: Trading isn’t just about analyzing markets; it’s also about making decisions under pressure. A well-defined strategy acts as a decision-making framework, guiding traders on when to enter and exit trades, and how to respond to certain market conditions. This systematic approach eliminates guesswork and reduces the impact of emotions on trading decisions.
- Consistency: Consistency is vital in trading. Not every trade will be profitable, but a consistent approach allows traders to evaluate the efficacy of their strategy over time. This iterative process means constantly learning from both successes and failures, refining strategies for better results in future trades.
Fundamental Analysis
What is Fundamental Analysis?: At its core, fundamental analysis delves into the intrinsic value of a currency by examining related economic, social, and political factors. This comprehensive analysis aims to predict future currency movements by understanding the underlying forces that drive economies.
Key Economic Indicators to Watch
- Interest Rates: These rates, set by central banks, influence the appeal of a country’s currency. Higher interest rates can offer lenders in an economy a higher return relative to other countries. Consequently, higher rates often attract foreign capital, leading to appreciation of the country’s currency. However, it’s not just the rate itself, but expectations of future rate changes that can influence currencies.
- Employment Numbers: Employment statistics give insights into an economy’s health. A steadily decreasing unemployment rate might suggest that an economy is running near its capacity, leading to potential wage inflation and higher consumer spending. Both can be beneficial for a country’s currency.
- Inflation Reports: Inflation erodes purchasing power when it’s too high and can lead to economic stagnation when too low. Central banks often target a moderate inflation rate, so deviations from this target can influence monetary policy and, by extension, currency values.
- GDP: Gross Domestic Product represents the total value of goods and services produced over a specific time period within a nation’s borders. It’s a broad measure of overall domestic production and paints a picture of an economy’s health. A robust and growing GDP often strengthens a nation’s currency.
Geopolitical Events
Beyond standard economic indicators, currencies are also influenced by less predictable geopolitical events. These can range from elections, trade negotiations, and international conflicts, to unexpected political events. While hard to predict, they can cause significant short-term volatility.
Advantages and Disadvantages
Fundamental analysis offers an in-depth understanding of the forces driving currency values, making it ideal for long-term predictions. However, its depth can also be a drawback: it requires significant time and expertise to master. Moreover, because it often focuses on long-term trends, it might not capture short-term market fluctuations effectively.
Technical Analysis
What is Technical Analysis?: Technical analysis is the discipline of evaluating investments and identifying trading opportunities by analyzing statistical trends gathered from trading activity, such as price and volume. Unlike fundamental analysts, who attempt to evaluate an asset’s intrinsic value, technical analysts focus on charts of price movement and various analytical tools to evaluate an asset’s strength or weakness.
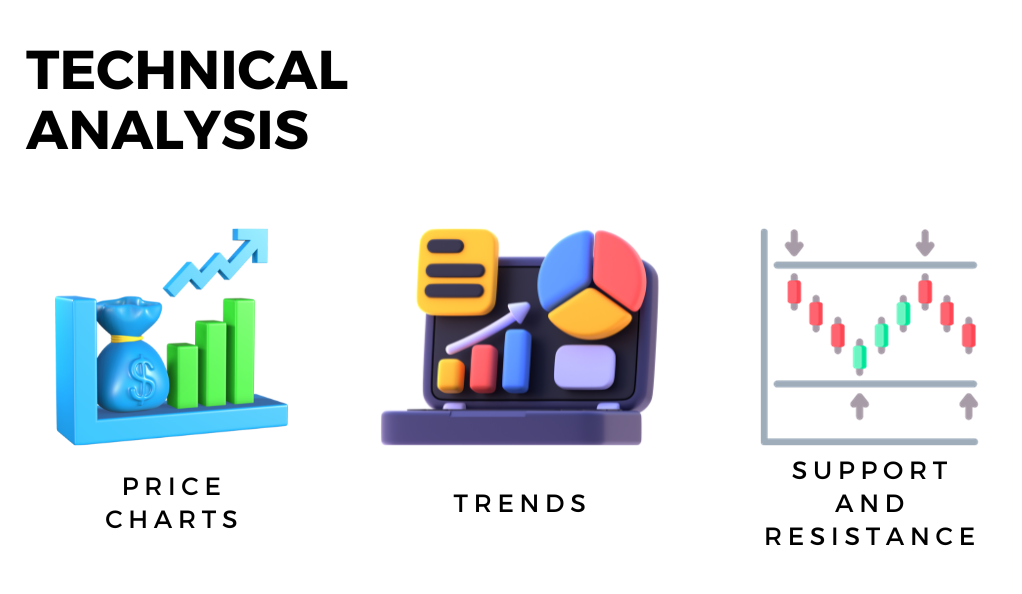
Components of Technical Analysis
- Price Charts: The foundational tool for a technical analyst is a price chart. The most basic version is a line chart, though others like bar charts, candlestick charts, and point and figure charts are also popular.
- Trends: In technical analysis, price movements are believed to follow trends. This means that after a trend has been established, the future price movement is more likely to be in the same direction as the trend than to be against it.
- Support and Resistance: Support is a price level where a downtrend can be expected to pause due to a concentration of demand. Resistance is a price level where an uptrend can be expected to pause due to a concentration of supply.
Basic Chart Patterns
Recognizing certain formations or sequences in price movements can be indicative of future activity. Some widely acknowledged patterns include:
- Bullish/Bearish Flags: These patterns resemble a flag on a pole and typically indicate a continuation of the current trend.
- Triple Tops/Bottoms: These are reversal patterns that signify a move opposite to the current trend, indicating potential exhaustion of the trend.
- Head and Shoulders: This is another reversal pattern, which can be either bullish or bearish, indicating a forthcoming change in the trend.
Technical Indicators
Derived from mathematical formulas applied to price history, these indicators assist in predicting future price movements:
- Moving Averages: Used to identify price trends by flattening out large fluctuations. The two most common types are the Simple Moving Average (SMA) and the Exponential Moving Average (EMA).
- Relative Strength Index (RSI): Measures the speed and change of price movements and signals overbought or oversold conditions.
- Bollinger Bands: A volatility indicator that consists of a middle band being an N-period simple moving average (SMA) and an upper and lower band.
- MACD (Moving Average Convergence Divergence): A trend-following momentum indicator that shows the relationship between two moving averages of an asset’s price.
Timeframes
Every trader has a different horizon in which they operate, but there are three general timeframes that traders fall into:
- Short-term: Typically uses 1-minute to hourly charts.
- Medium-term: Daily charts are commonly referenced.
- Long-term: Weekly or monthly charts provide a broader view of price movements.
Advantages and Disadvantages
While technical analysis provides traders with a quick snapshot and tools for short-term view, it is often criticized for not considering the fundamentals of an asset. Critics argue that past trading activity isn’t necessarily a predictor of future price movement, making it potentially less reliable.
Sentiment Analysis
Sentiment analysis, in the context of trading, refers to the process of gauging the collective mood or general sentiment of traders in a particular market. The prevailing sentiment, whether bullish or bearish, can strongly influence price action.
Tools for Gauging Market Sentiment
- COT (Commitments of Traders) report: Issued by the Commodity Futures Trading Commission, this tool showcases the net long and short positions taken by institutional traders. It provides insights into how the big players are positioning themselves and can serve as a potential leading indicator of future price movements.
- Retail Trading Sentiment Indicators: Platforms like DailyFX offer sentiment indicators showcasing the positioning of retail traders. Since retail traders are known to often be on the wrong side of the trade, some use this as a contrarian indicator.
- News and Social Media: The proliferation of real-time news and social media platforms can offer immediate sentiment readings. Tools like StockTwits or even Twitter sentiment analysis tools can provide insights into the current mood around particular assets.
Limitations
While sentiment can offer valuable insights, it’s essential to recognize its limitations. Markets are complex, and myriad factors can influence price movements. Additionally, sentiment can change rapidly, particularly in reaction to breaking news or geopolitical events. It’s also worth noting that extreme sentiment readings, either overly bullish or bearish, can often precede market reversals.
Common Trading Strategies
Trend Following Strategies
Trend followers aim to capitalize on market momentum. They believe that once a trend starts, it is likely to continue. Common tools and techniques include:
- Moving Averages: This indicator helps smoothen price data to create a single flowing line, which makes it easier to identify the direction of the trend.
- MACD (Moving Average Convergence Divergence): This tool measures the relationship between two moving averages of prices.
- ADX (Average Directional Index): Used to quantify the strength of a trend.
Range-Bound Strategies (or Channel Trading)
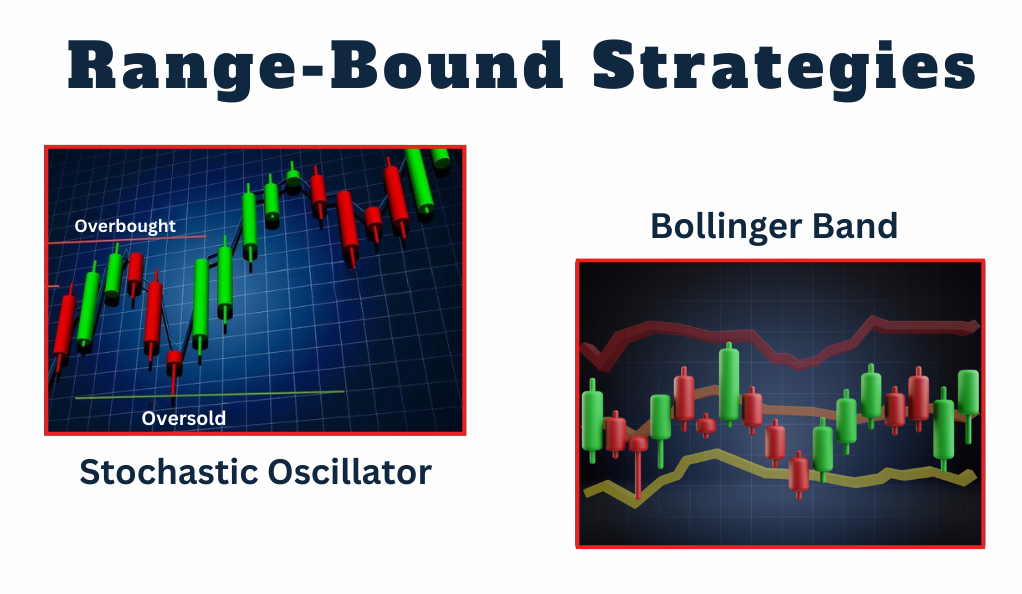
Markets don’t always trend. Sometimes they move within a horizontal range. Tools commonly used include:
- Stochastic Oscillator: Identifies overbought and oversold conditions.
- Bollinger Bands: These bands adjust themselves to the market conditions. When the markets become more volatile, the bands widen (move further away from the average), and during less volatile periods, the bands contract (move closer to the average).
Breakout Strategies
A breakout signifies when the price moves outside a defined support or resistance level with increased volume. A trader may buy when the price breaks above resistance or sell when it breaks below support.
- Position Trading: This longer-term strategy is based on in-depth fundamental and technical analysis. Position traders often base their decisions on macroeconomic factors and trends, holding onto trades for weeks, months, or even years.
- Scalping: Scalping is a strategy where traders aim to profit from small price changes throughout the day. It requires quick decision-making and execution, and traders often operate on very short timeframes, like 1-minute or 5-minute charts.
- Swing Trading: This approach tries to capture the “swing” or the change in momentum in price movements. Swing traders often use technical indicators like RSI and MACD to find oversold or overbought conditions.
- Carry Trade Strategies: In Forex, this involves borrowing money in a currency with a low interest rate and investing it in a currency with a higher interest rate. Traders earn the difference between the interest rates (the “carry”).
Risk Management in Forex
Risk Management is the cornerstone of successful trading. Protecting one’s capital is just as crucial, if not more so, than making profits.
- Setting Stop Loss and Take Profit levels: Predetermined levels where a trader exits a position, either to lock in profits (Take Profit) or to cap a loss (Stop Loss). Automation of these can remove emotional decision-making from the trading process.
- Leverage: This is a double-edged sword. While it can amplify profits, it can also intensify losses. Traders should use leverage wisely and understand the implications fully before deploying it.
- Position Sizing: Determining how much of one’s portfolio to risk in a single trade. A common rule is not to risk more than 1-2% of one’s trading capital on any single trade. This ensures sustainability even after a series of losses.
- Emotional Management: One of the most understated aspects of trading. Emotions like fear and greed can heavily influence trading decisions, often to the detriment of the trader. Developing a trading plan, sticking to it, and regular self-assessment can help in managing emotions.
Additionally, constant learning, regular market analysis, and adapting to changing market conditions are integral parts of successful Forex trading.
Conclusion
Forex trading is both an art and a science. It requires preparation, discipline, and a continual willingness to learn. While the potential rewards are significant, so too are the risks. A diligent approach to education, paired with a robust trading strategy, can set one up for success in the world of Forex.
Additional Resources
Books, webinars, and online courses can be valuable assets. Websites like Investopedia or BabyPips provide invaluable educational resources, while forums like Forex Factory offer insights into the pulse of the trading community.
Arming oneself with knowledge is the first step toward successful Forex trading.